
This year’s RASNZ Conference is being held online, via YouTube, due to the pandemic. As part of this week’s talk, Steve Butler, President of the Royal Astronomical Society of New Zealand talked about the subject he is most passionate about; light pollution, and how data from the VIIRS instrument on the Suomi NPP satellite is making it easier to understand and track changes in light pollution over time.
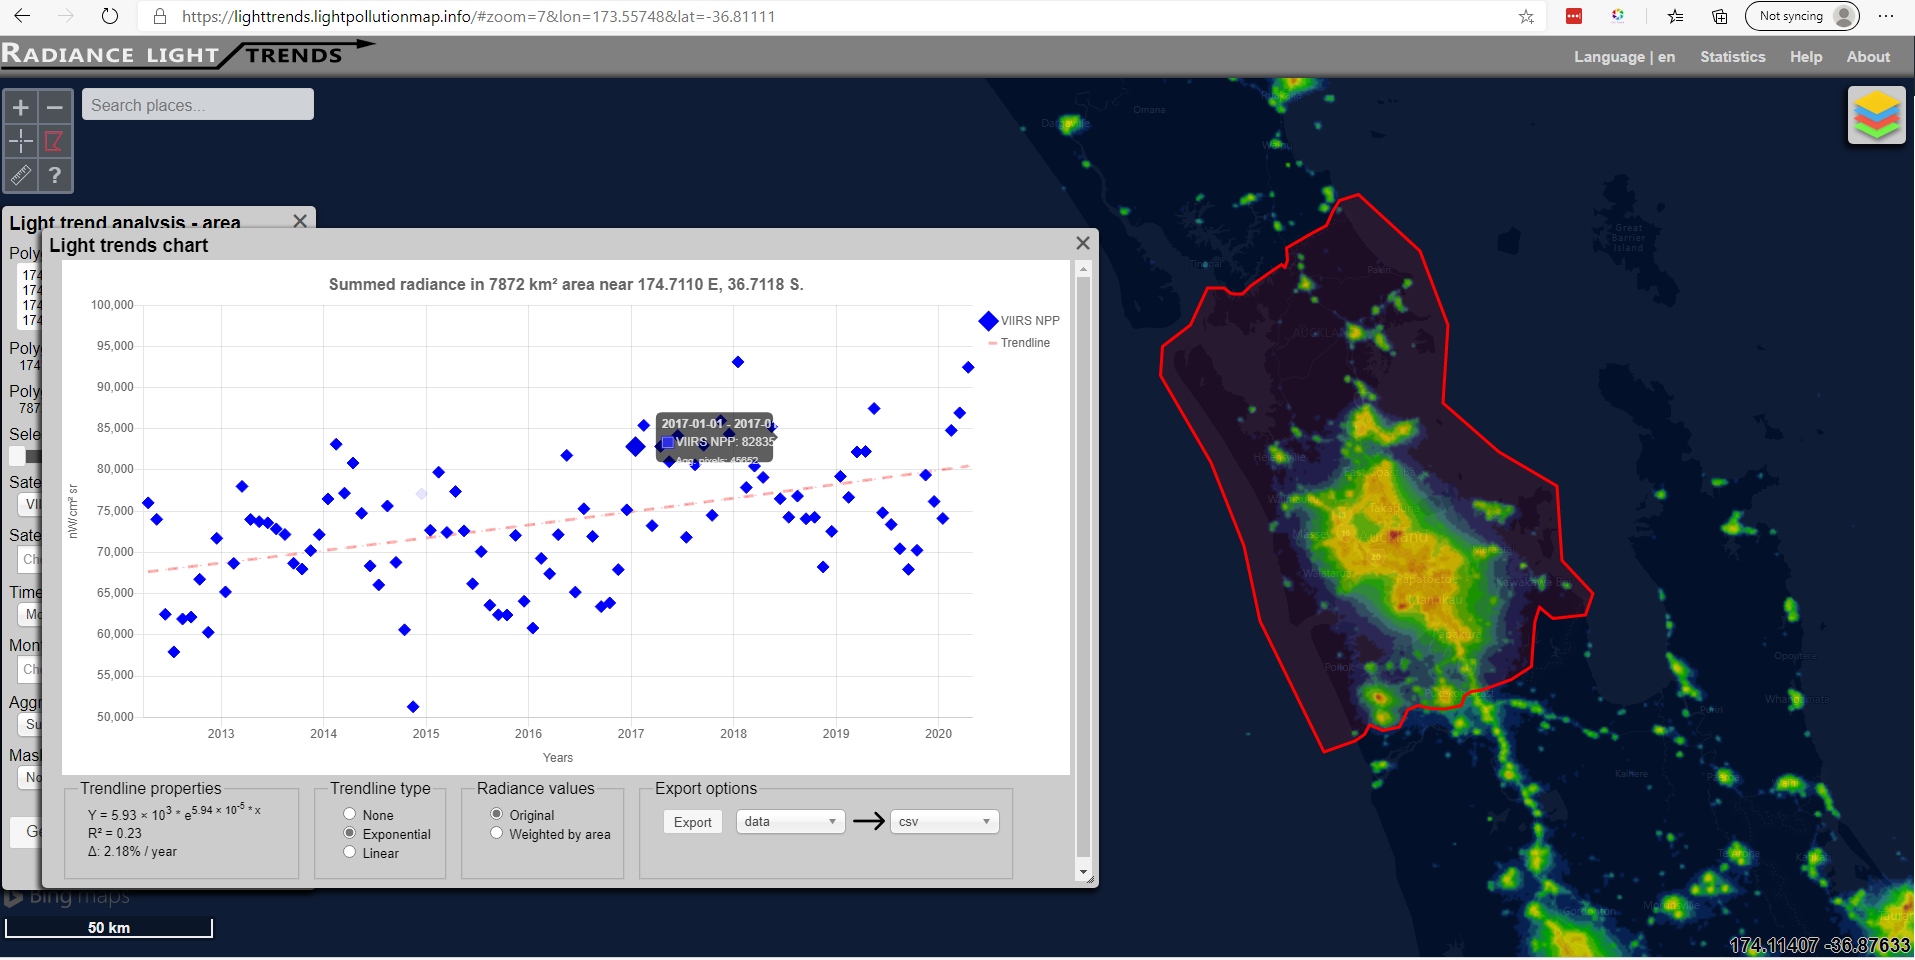
Using the https://lighttrends.lightpollutionmap.info/ website it is possible to graph light pollution measurements over time in a geographic area. Steve mentioned on the stream that he would love to see all the RASNZ affiliated societies post up the graphs of the sky brightness changes in their region as a tangible way to start a conversation about this growing issue.
The data for Auckland (using the approximate local council boundary – excluding Great Barrier), the trend is clearly upwards with a change of about 2.5% per year. With the growth of the city and new developments sprawling into the otherwise “dark” areas on the map, it’s perhaps not too surprising – but it does certainly give both pause for thought, and hopefully motivation for highlighting this ever growing issue.

It’s certainly worth watching Steve’s presentation, as well as, of course, the earlier talk on the same video from Dr Heloise Stevance who discusses her technique to estimate the age of star clusters such as Matariki. There are more RASNZ lectures to come this month for the 2020 Online Conference – so head over to the RASNZ YouTube channel, and please do like and subscribe!